Network Intelligence: 10 Critical Use Cases
Modern networks stretch across clouds, data centers and the public internet. Monitoring tools give you statistics, but they rarely connect the dots between traffic metrics and the services and customers they impact. Network intelligence takes observability a step further by fusing high‑fidelity telemetry with business context and machine learning. It surfaces what’s normal, predicts what’s coming and explains why anomalies occur — before users notice.
This article explores ten network intelligence use cases that are described further in Kentik’s ebook, 10 Critical Use Cases for Network Intelligence.
What is network intelligence?
Network intelligence is an AI-assisted layer on top of network observability that turns raw telemetry (flows, routing, device and cloud metrics, logs, and synthetics) plus business context into answers and actions. It correlates and explains issues, predicts risk (like SLA breaches), and can trigger remediation across on-prem and multicloud networks.
Older definitions focus on deep packet inspection (DPI) and communications-service-provider use cases. Kentik’s approach spans flows, routing, SNMP and cloud telemetry, contextual enrichment, and LLM-driven natural-language workflows. Today’s network intelligence is about moving beyond dashboards to proactive answers and actions.
With this definition, let’s look at ten of the most critical use cases for network intelligence.
Kentik in brief: Kentik’s Network Intelligence Platform turns raw telemetry into actionable outcomes across operations, cost, and security. Kentik combines flow and cloud flow logs with routing context, device metrics, and synthetic testing so teams can baseline “normal,” detect meaningful changes, predict risk to SLAs, and answer “what changed?” with context and AI-assisted investigations, instead of guesswork.
Learn how AI-powered insights help you predict issues, optimize performance, reduce costs, and enhance security.
1. Correlate diverse data to provide contextualized network visibility
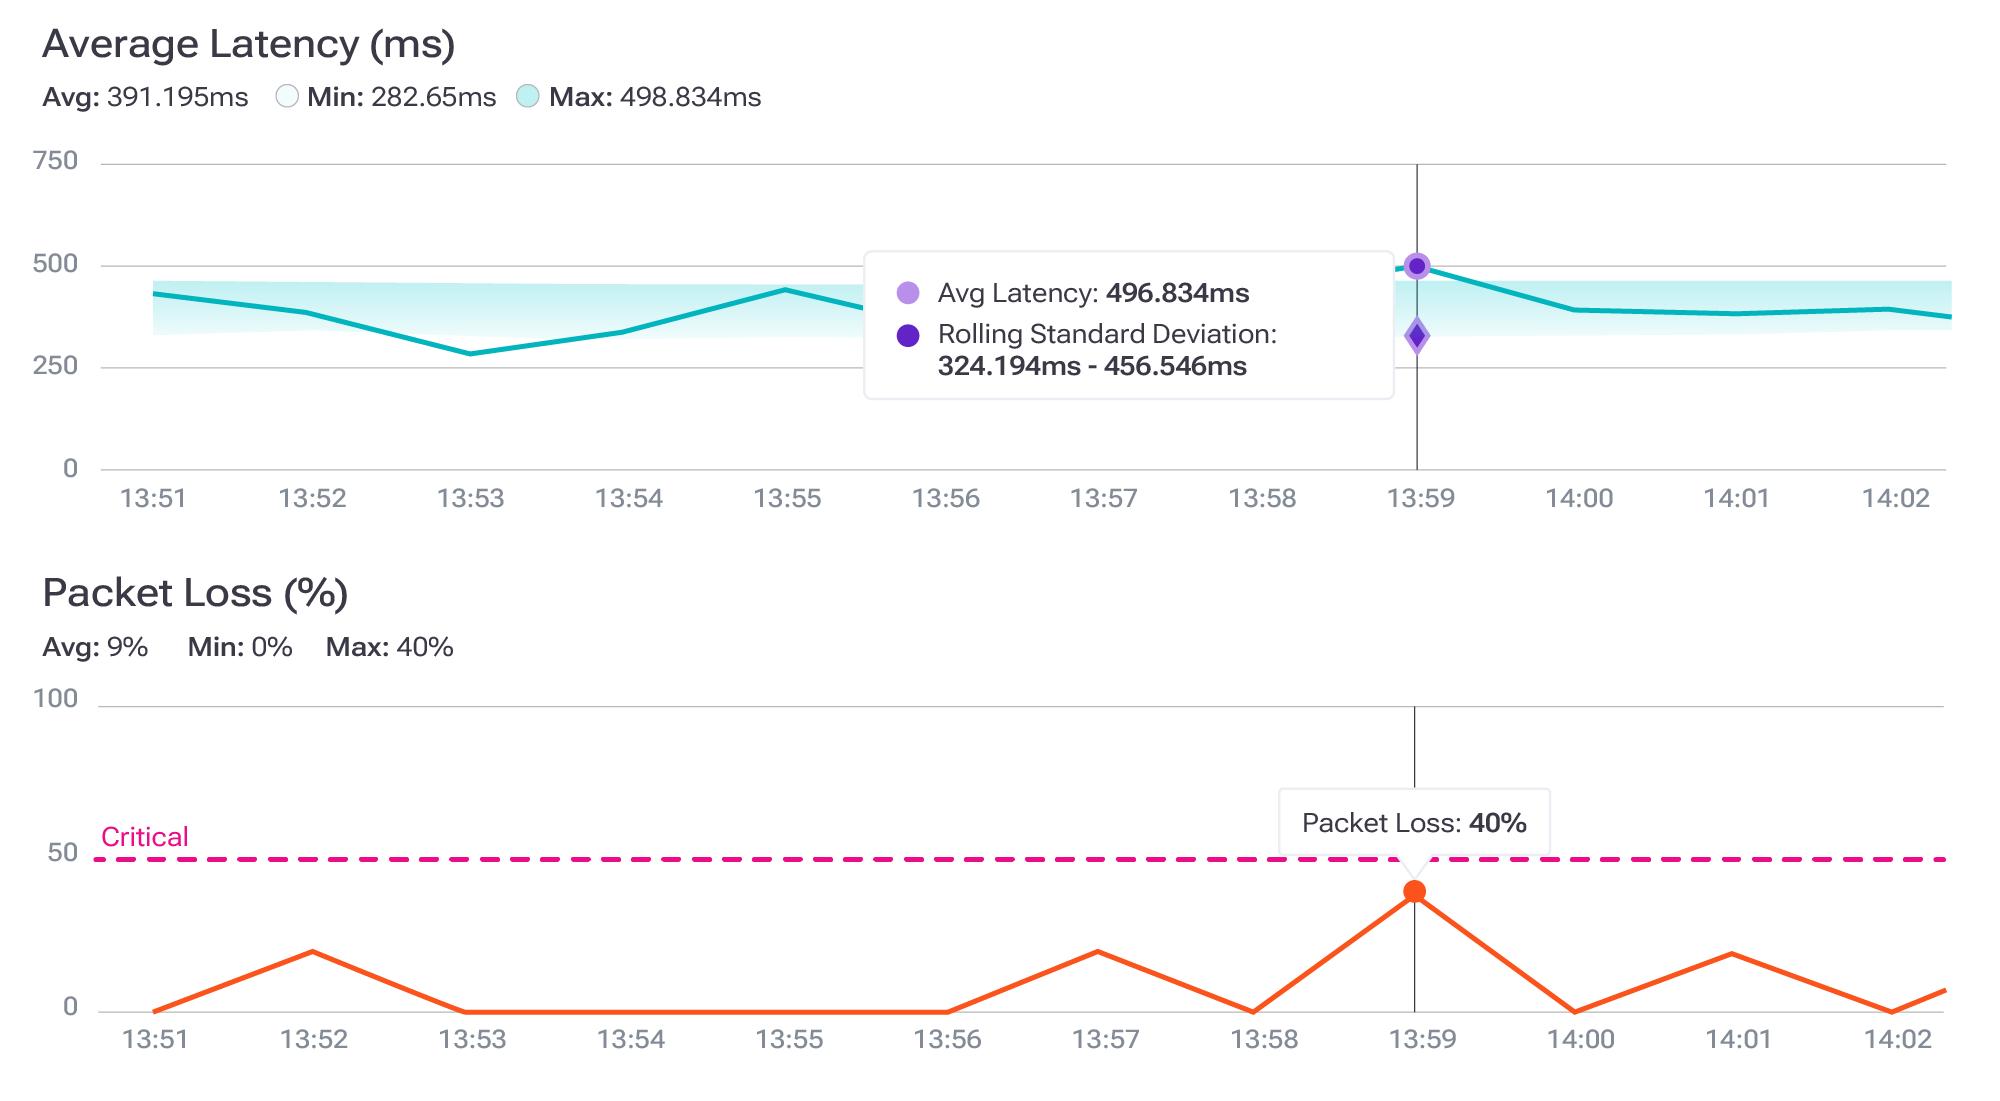
Network intelligence ingests high‑volume telemetry (flows, routing tables, metrics and logs) and enriches it with business dimensions such as applications, customer segments and revenue impact. Instead of staring at separate graphs for latency and packet loss, engineers see a single narrative about which service is affected when packets drop. Contextualized visibility reduces mean time to resolution and helps teams prioritize triage activities based on business impact.
2. Identify traffic patterns, seasonality, baselines and benchmarks
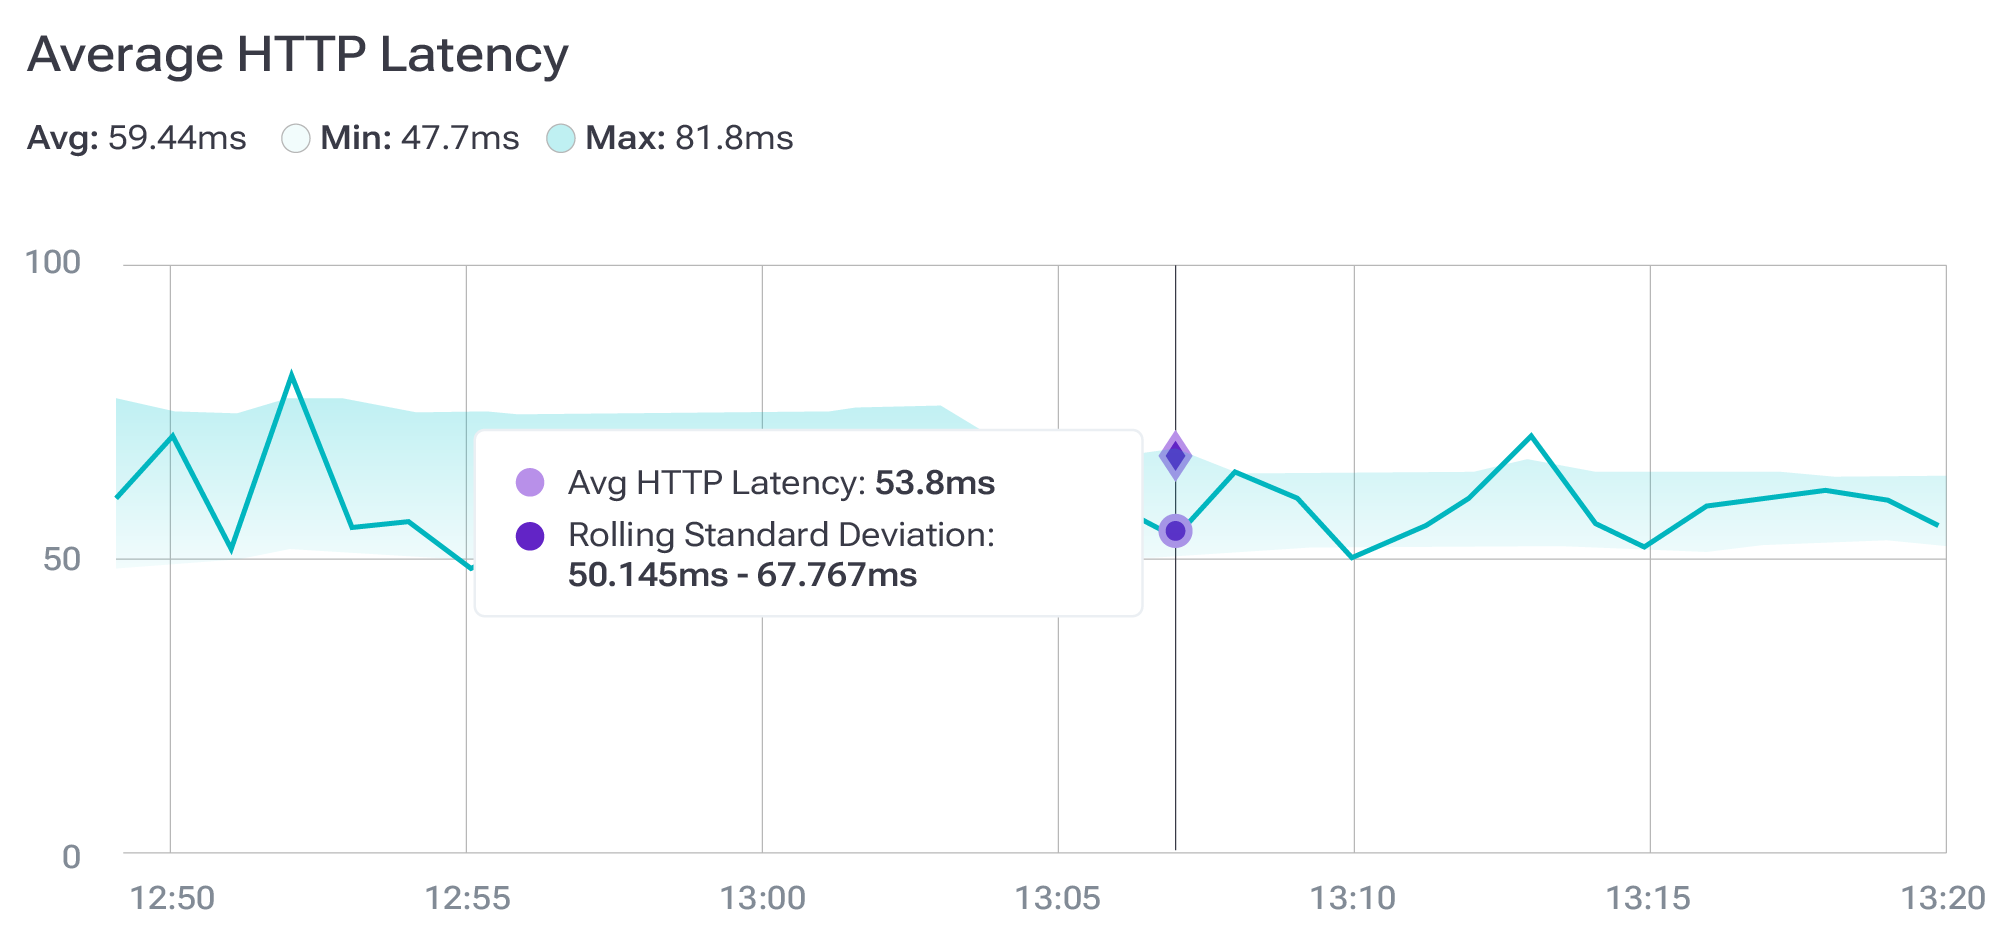
By continuously analyzing network data, network intelligence learns the natural rhythm of network traffic — from lunchtime video spikes to quarter‑end ERP surges. It establishes dynamic baselines and benchmarks that adapt as the environment grows while still flagging anomalies and sending alerts when performance drifts from service‑level targets. Machine‑learning models capture seasonality patterns so engineers can tell at a glance whether a peak is expected or problematic.
3. Intelligent traffic engineering
Raw telemetry becomes an always‑on traffic‑engineering brain when paired with AI. Models monitor latency, jitter, loss and link utilization in real time, predict congestion before it happens and recommend adjustments to mitigate it. They can even suggest which circuits to drain for maintenance during low‑utilization periods and when to shift bulk transfers to off‑peak paths. The result is faster page loads, more stable SaaS performance, fewer outages and lower transit costs.
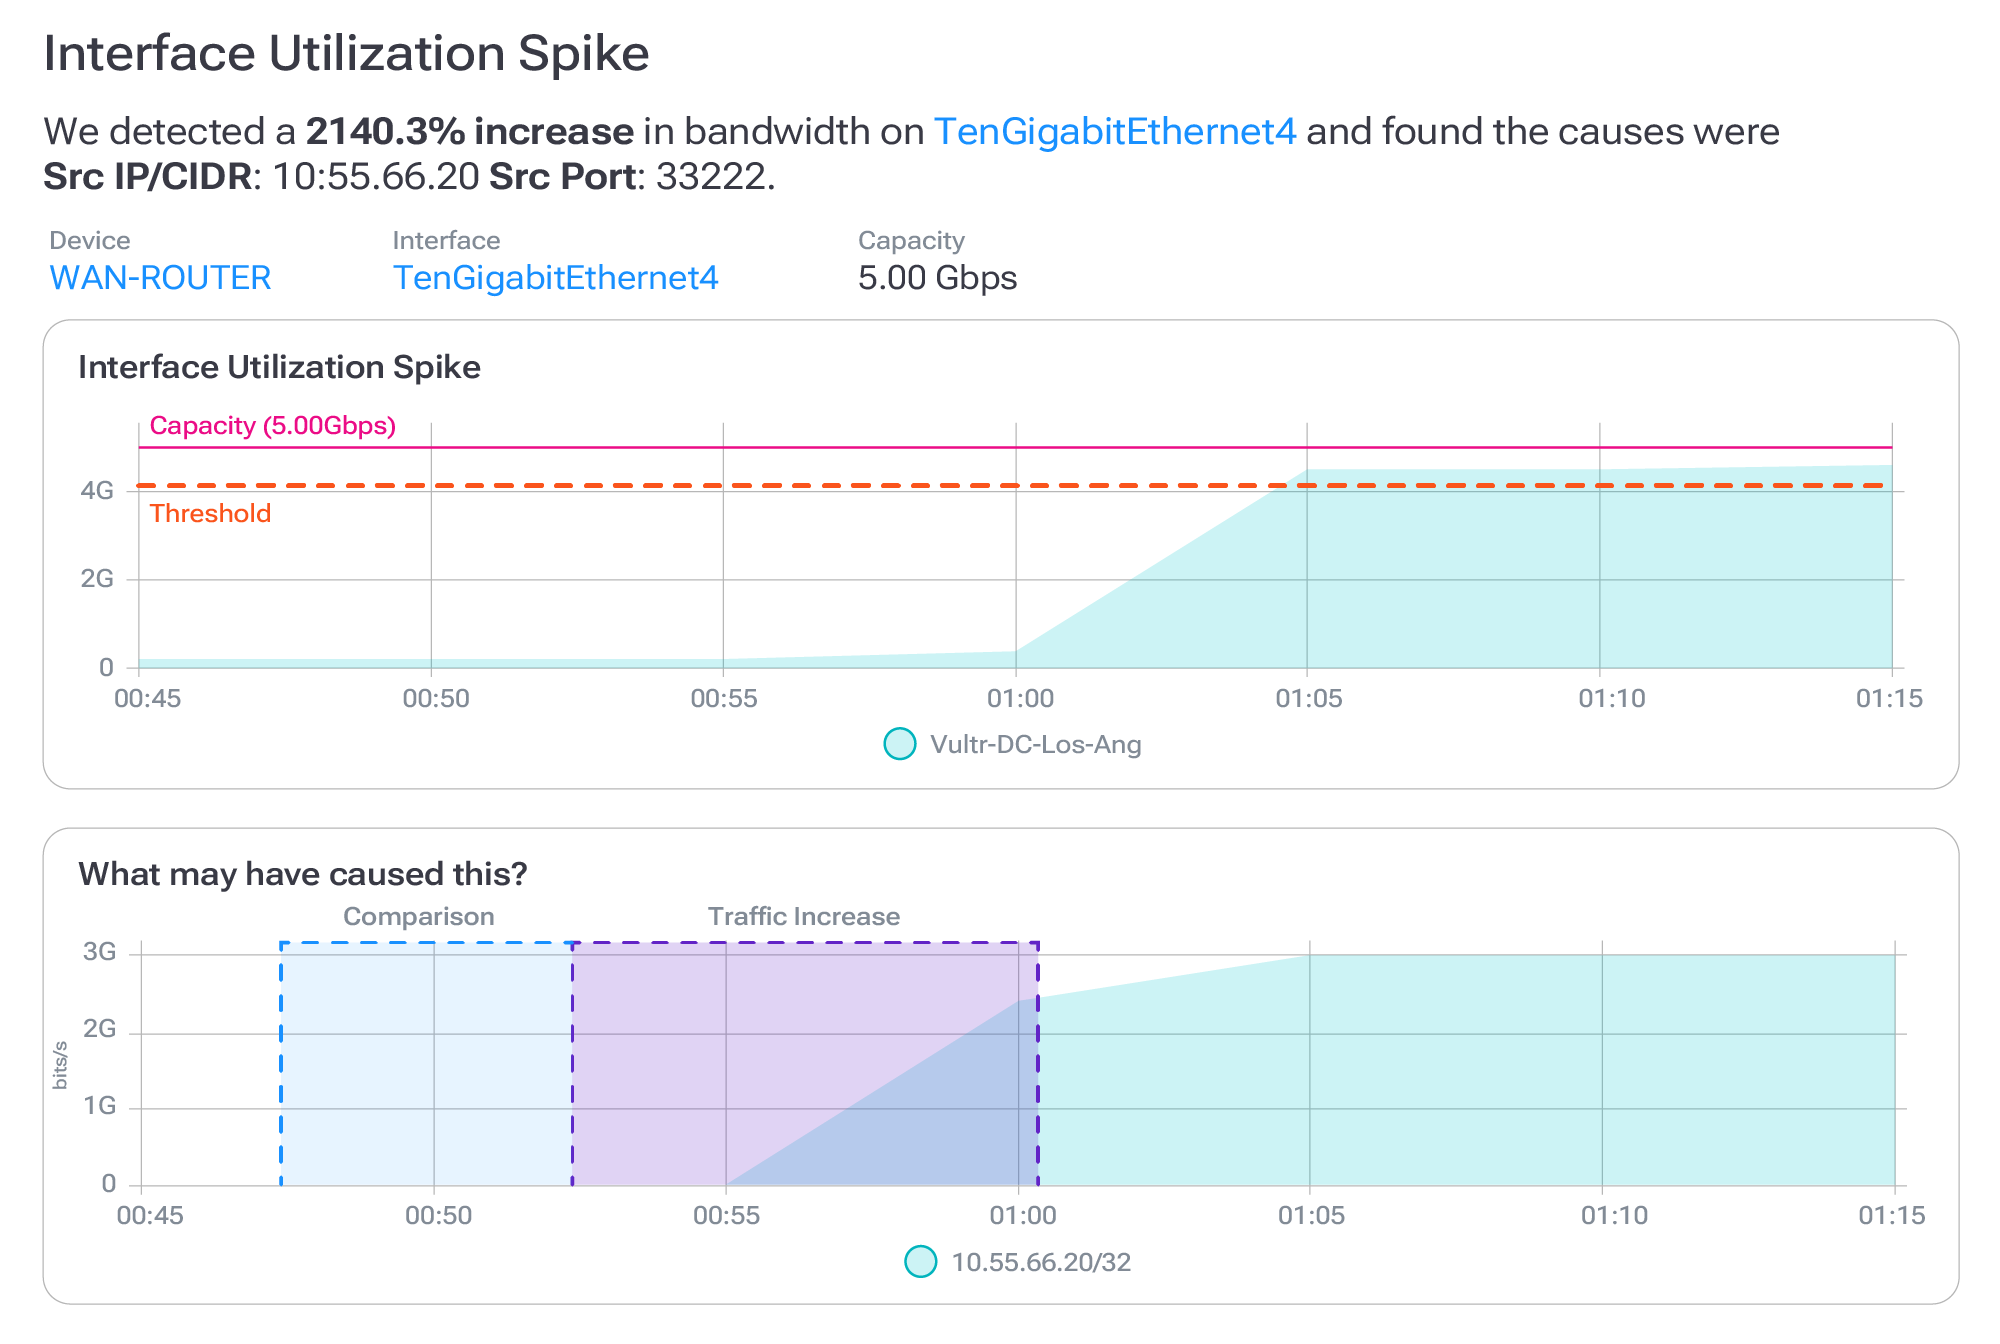
4. Capacity planning
By combining real‑time and historical flow records, interface counters, application response times and even cloud‑billing data, network intelligence forecasts when and where links will saturate. It detects long‑term growth trends, learns demand cycles and runs “what‑if” scenarios (for example, launching a new SaaS region or weathering a marketing‑driven traffic surge).
With these insights, engineers can schedule upgrades months in advance, right‑size circuits, renegotiate contracts and shift traffic to off‑peak paths — avoiding both over‑ and under‑provisioning. Learn more about network capacity planning and how Kentik can help.
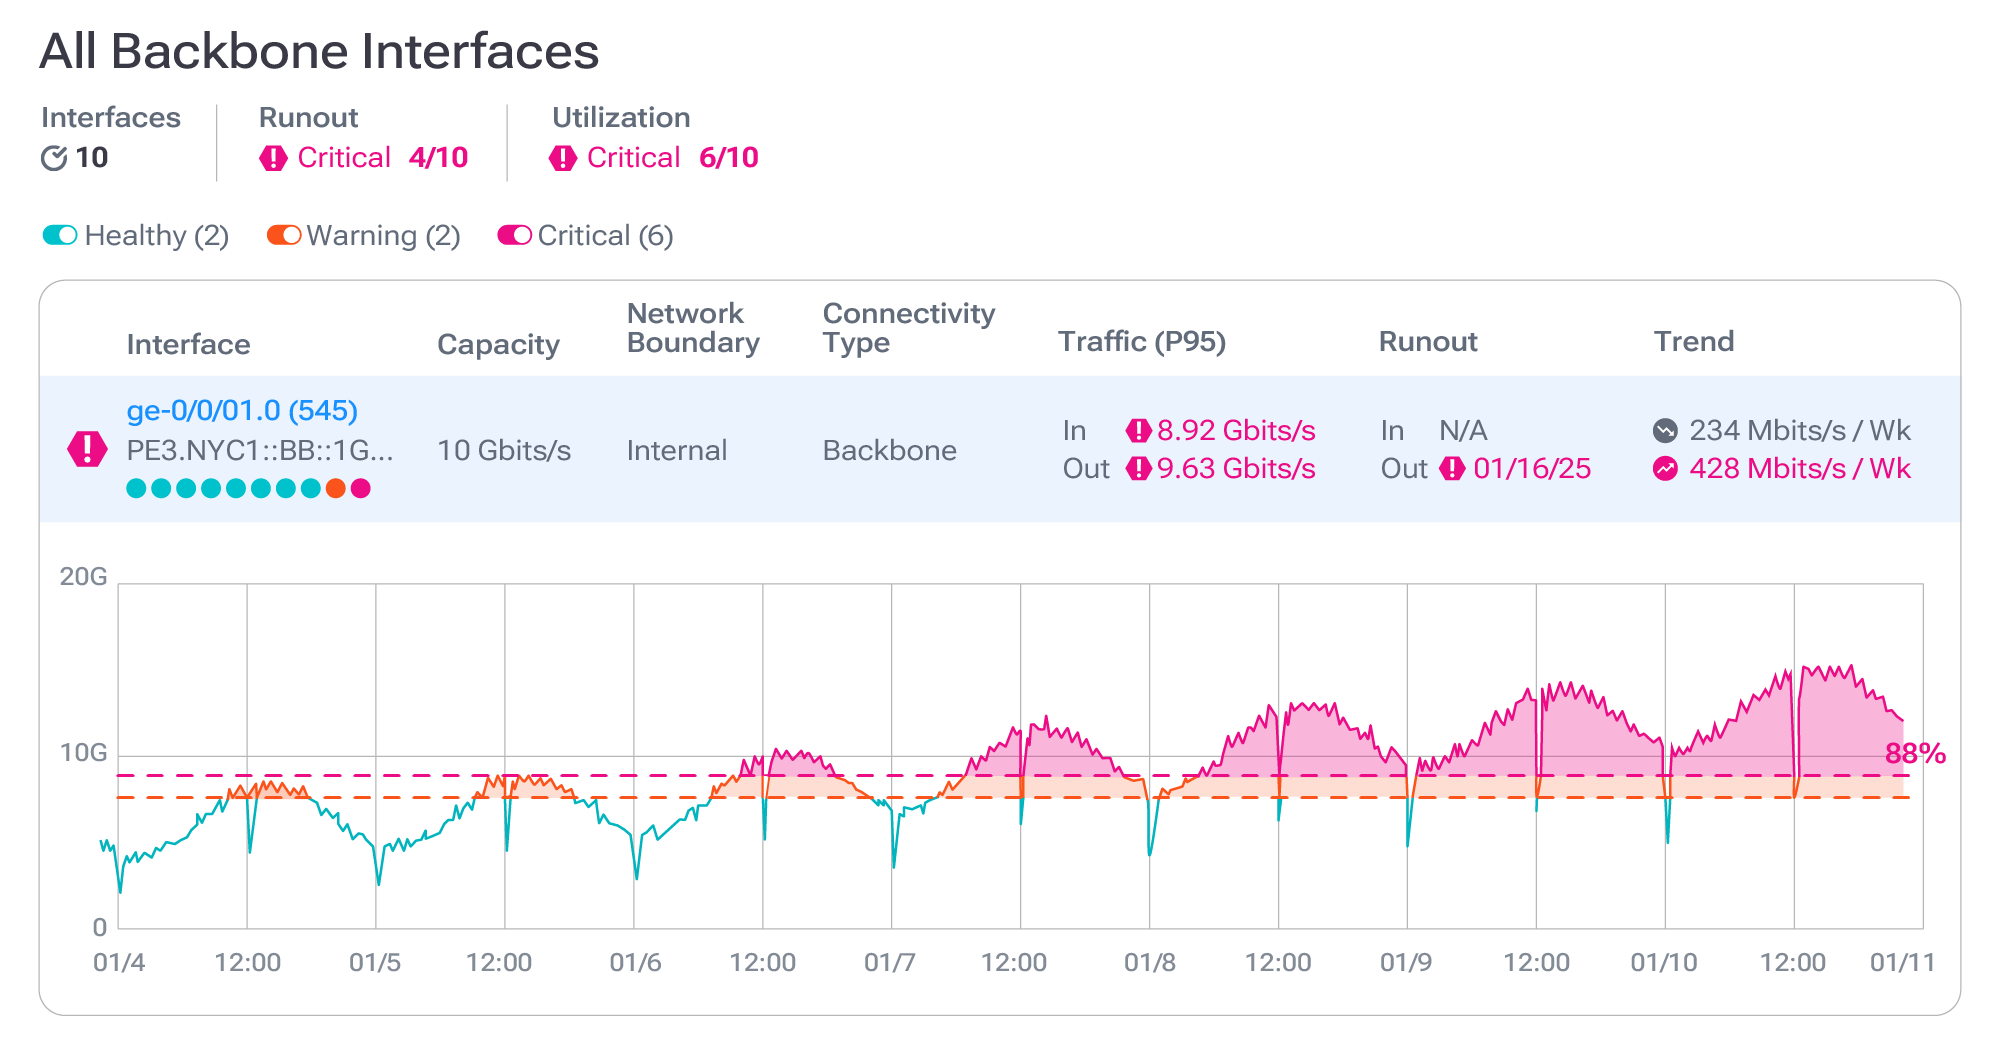
5. SLA violation prediction
Service‑level agreements often hinge on tight latency, throughput or packet‑loss budgets. Network intelligence computes rolling baselines for these metrics and predicts when an SLA is likely to be violated before the breach occurs. When telemetry deviates significantly from the learned baseline, the system measures the delta, flags it as an anomaly and can automatically alert operators or trigger remediation workflows.
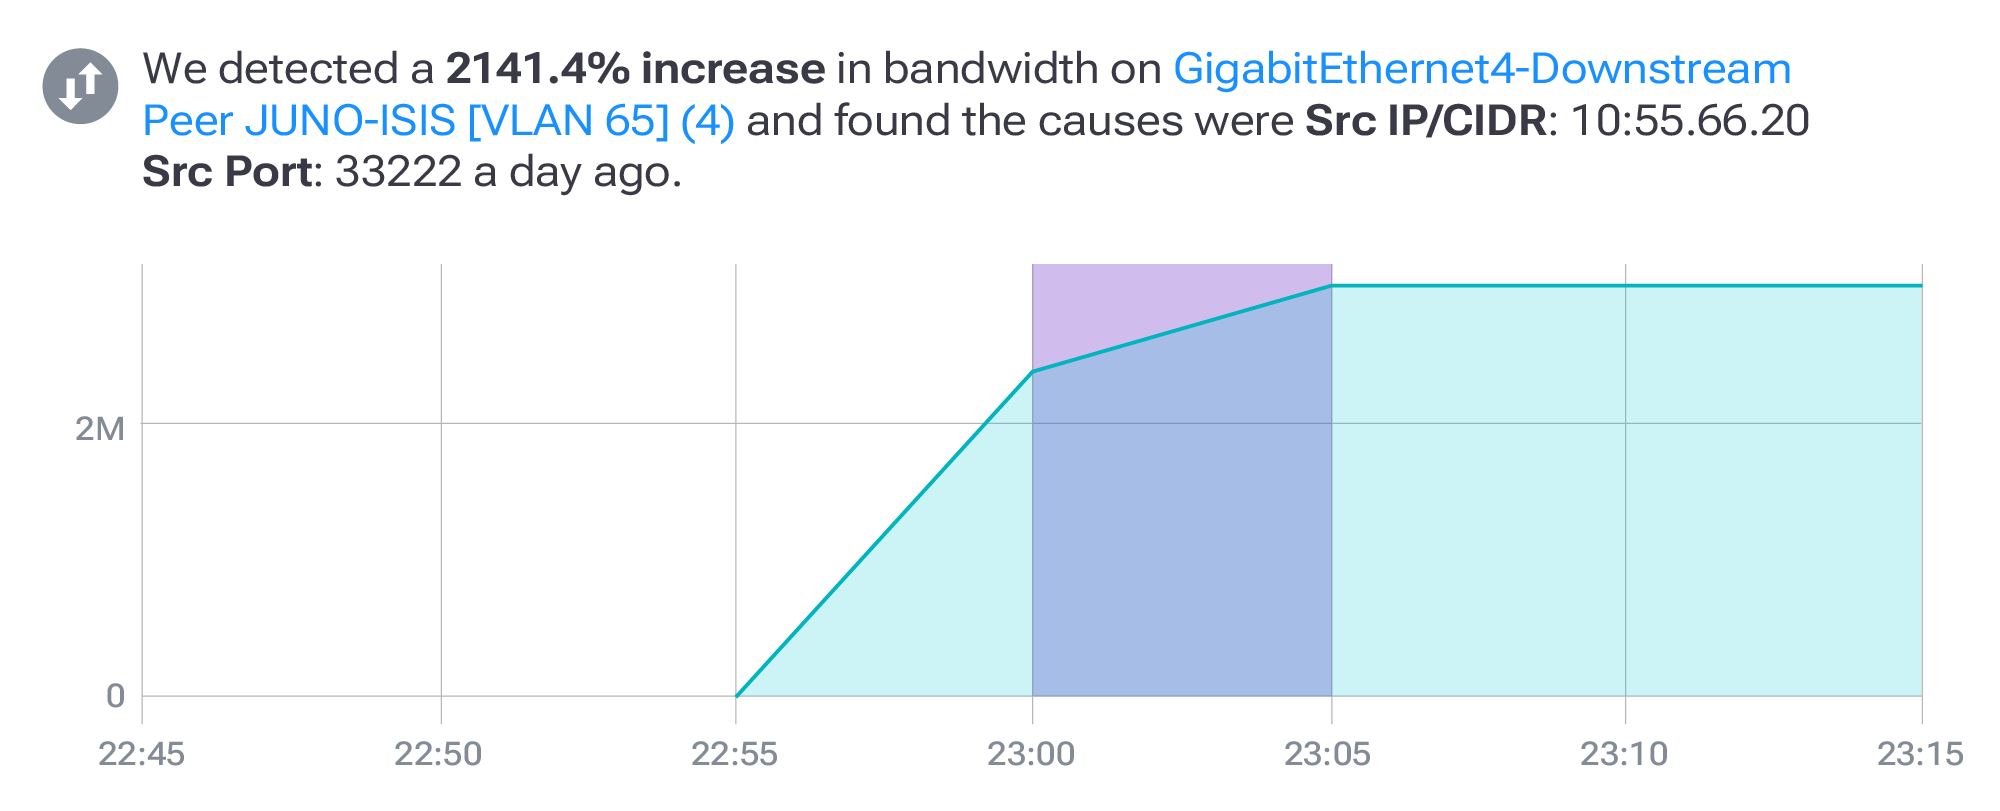
6. Troubleshoot connectivity and performance issues
Network intelligence synthesizes telemetry into a searchable context so engineers don’t have to pivot through dozens of dashboards. Kentik AI Advisor turns troubleshooting into an interactive dialogue: you ask in plain language, “Why can’t users in New York reach our SaaS front‑end?”, and the system automatically assembles the right flow queries, path traces and anomaly checks.
Because the conversational history is retained, follow‑up questions refine the scope (for example, filter by ASN or narrow to a five‑minute window) without losing context. This guided root‑cause analysis isolates not just the failing path but also why it failed and suggests remediations.
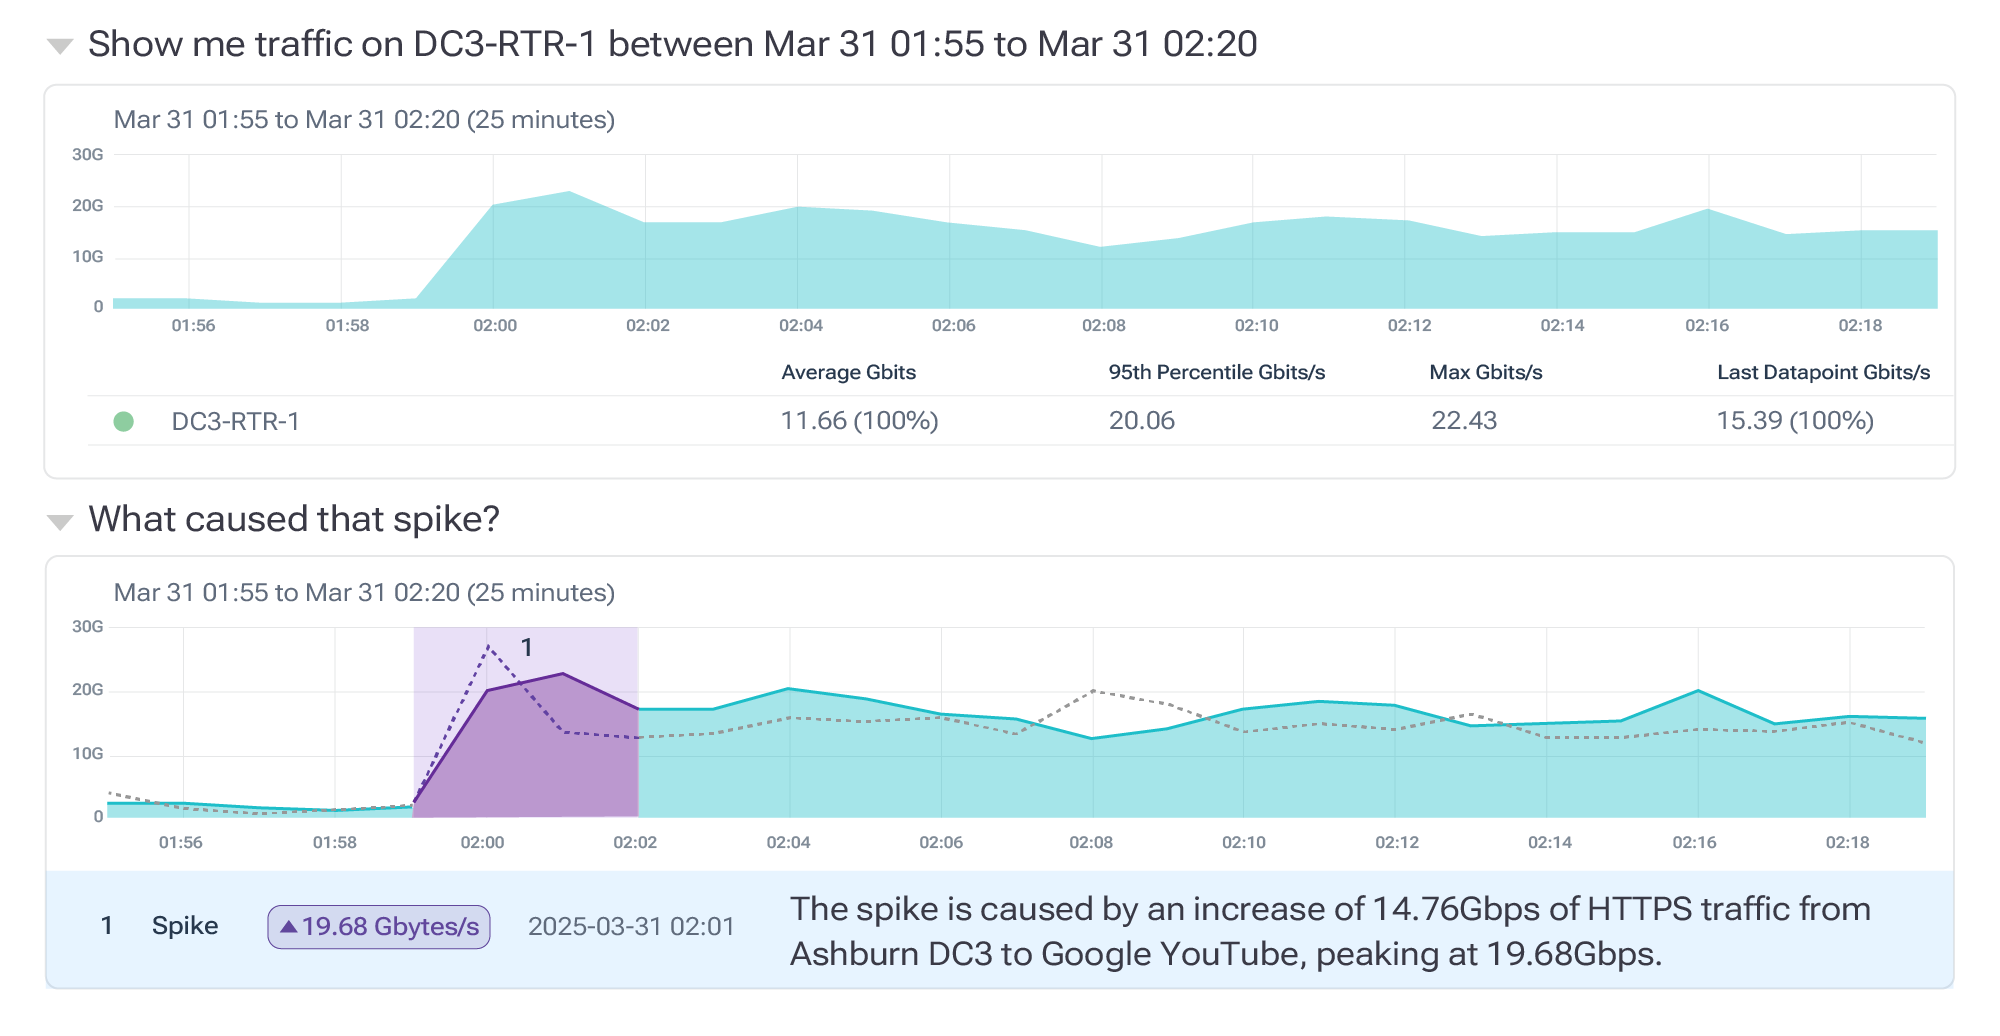
7. Intelligent incident triage
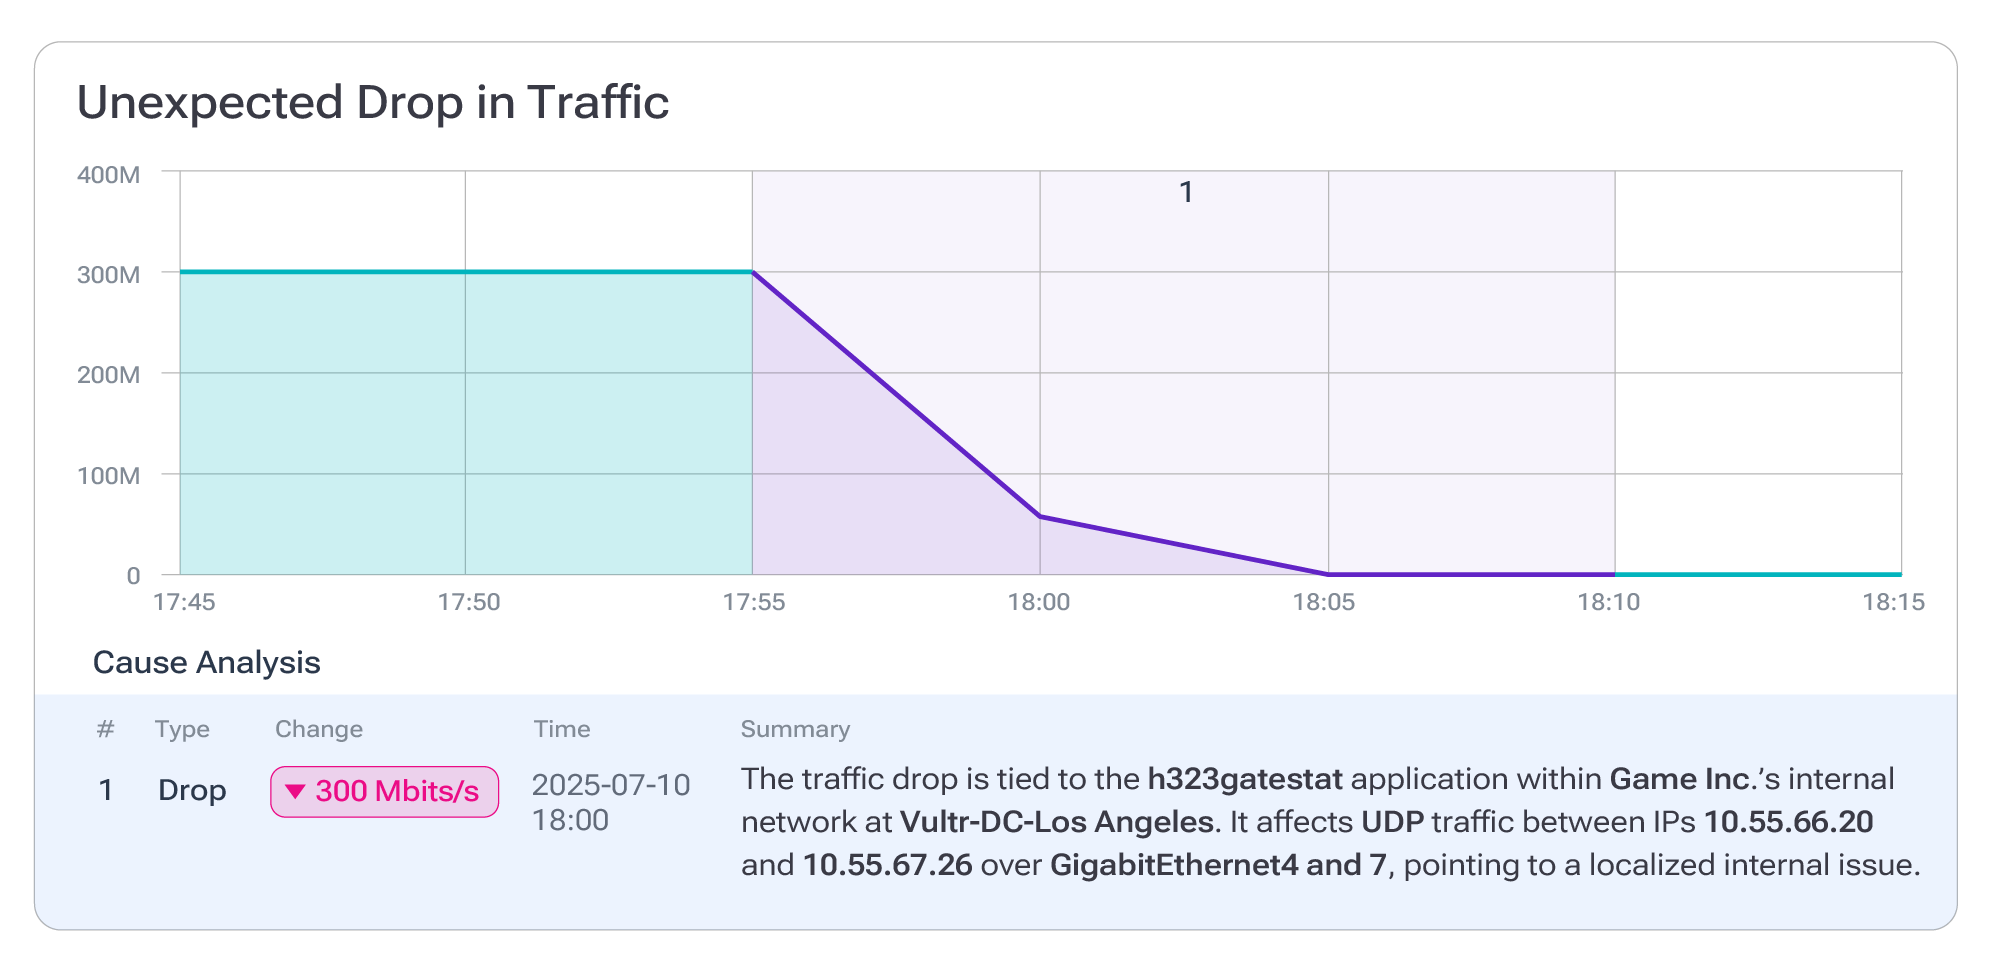
When an incident occurs, a network‑intelligence platform treats every flow record, BGP update and device metric as part of a single, time‑aligned dataset. It clusters events that share key dimensions (common AS paths, identical loss signatures or matching application tags) and presents them as a coherent narrative rather than a flood of isolated alerts.
Anomaly‑detection policies run in the background, and each hit is tagged with application context. The conversational AI then guides engineers through the triage, refining queries on the fly and revealing the root cause. With predetermined baselines and automated mitigations, teams get faster triage and fewer all‑hands calls.
8. DDoS detection
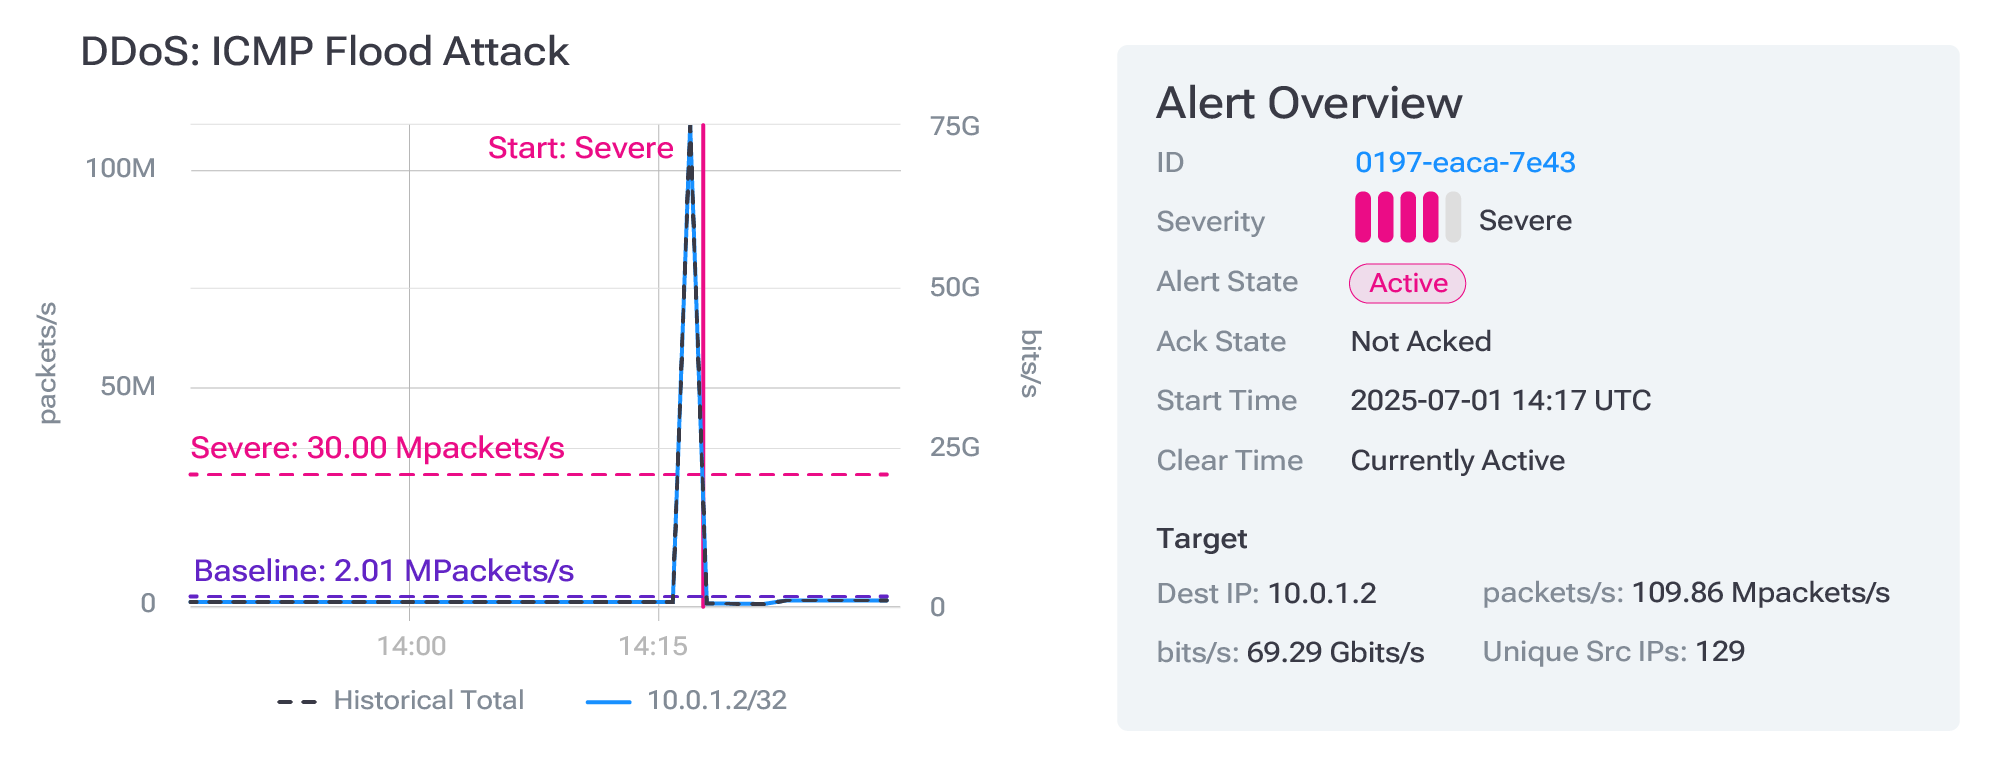
Network‑intelligence engines ingest flow, metrics and threat‑feed enrichments at line rate, learning normal traffic volumes, protocols and source‑destination pairs for every interface, location, application and customer. When inbound packets suddenly surge beyond those baselines — whether due to a volumetric flood, SYN storm or slow‑rate application attack — the system flags the deviation, enriches it with path and geolocation context and raises a “possible DDoS” event. It can then auto‑trigger mitigation via RTBH, a scrubbing service or a third‑party CDN, shrinking time‑to‑defense and enabling closed‑loop protection. Learn more about DDoS detection and how Kentik can help.
9. Identify potential security threats
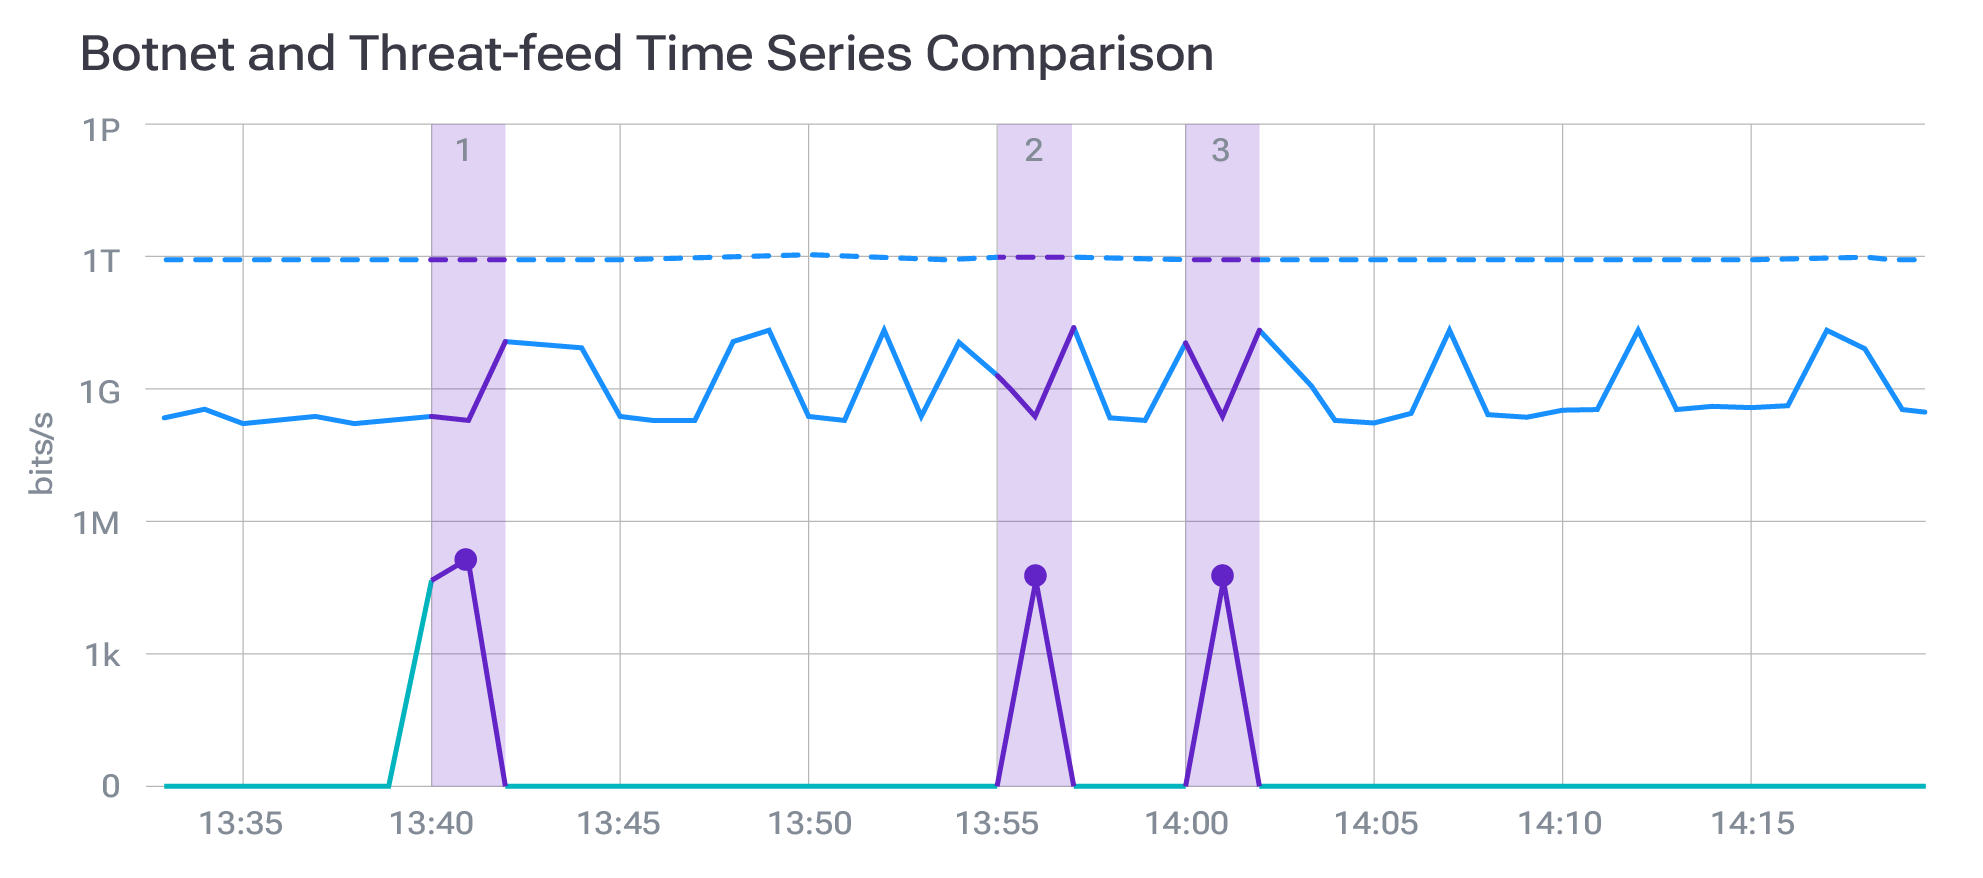
By baselining regular network behavior, network intelligence quickly flags anomalous activity such as an infected device sending high‑volume uploads to unfamiliar IP ranges or a service dribbling data out at odd hours. Historical telemetry lets analysts pivot back weeks to determine if a spike is a harmless backup or potential exfiltration. Engineers can simply ask to view all flows matching an exfiltration policy over a given window, and the platform generates the appropriate queries across its data engine, enriched by threat feeds and machine‑learning models.
10. Reliable data for closed‑loop automation and orchestration
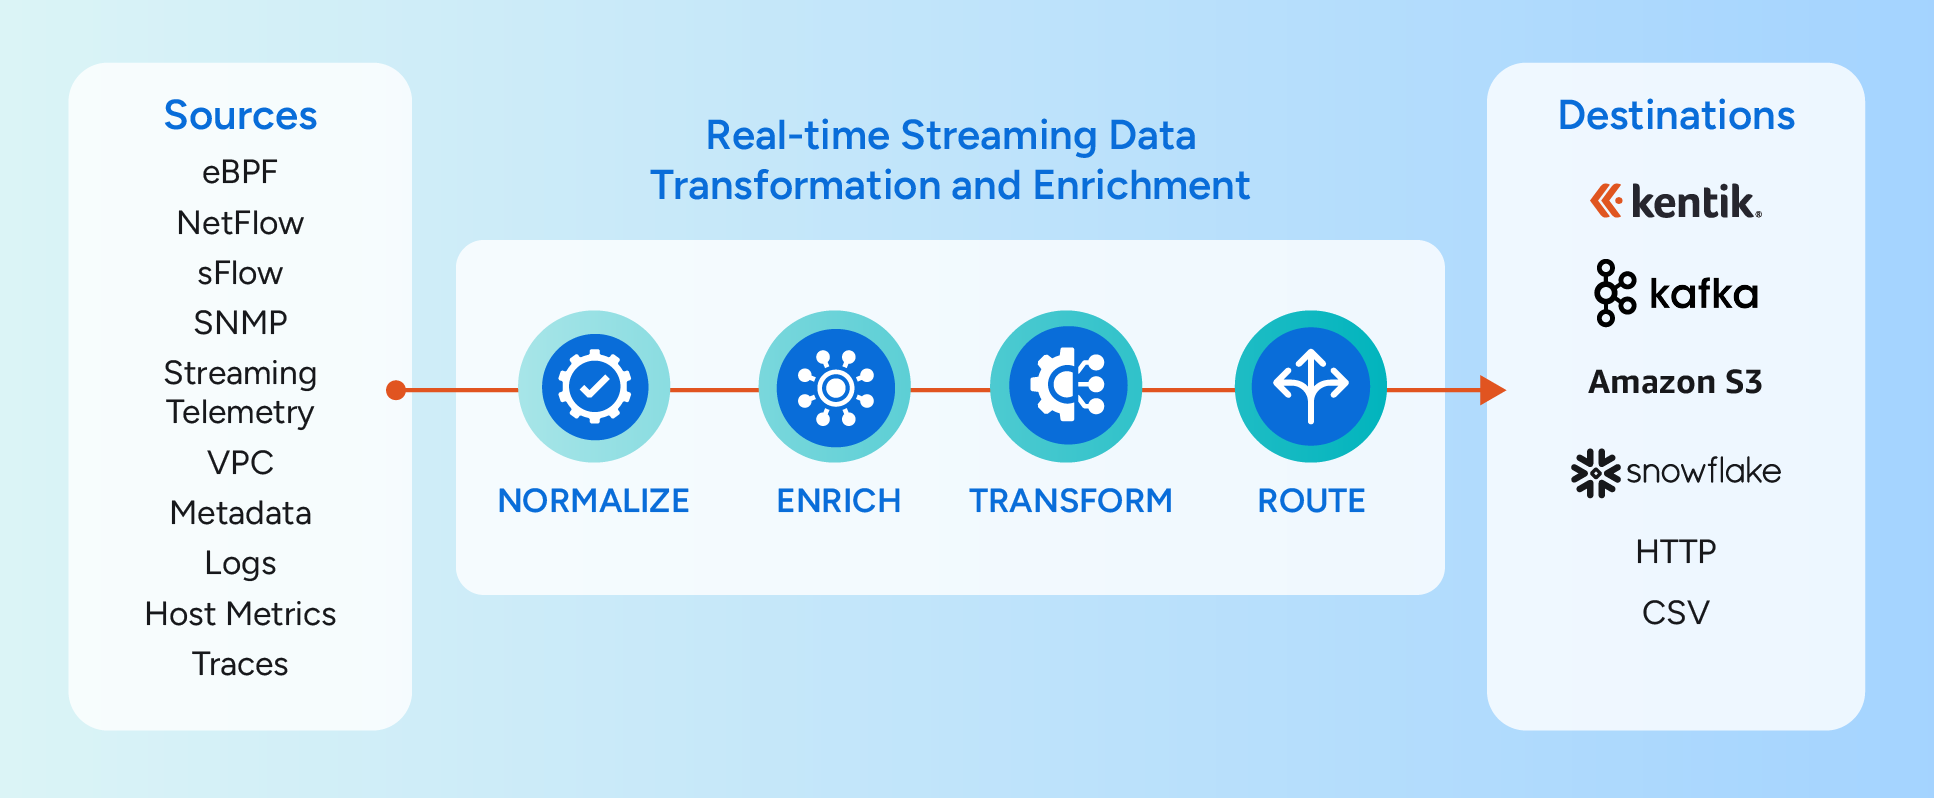
Network intelligence doesn’t just visualize telemetry—it provides a trustworthy data pipeline. Flow logs, BGP tables, SNMP counters, cloud metrics and host telemetry are ingested at line rate and passed through a built‑in extract‑transform‑load pipeline for normalization, enrichment, outlier filtering and feature extraction. This cleansed data is written into the Kentik Data Engine where queries return in sub‑second, machine‑learning‑ready form. Because Kentik owns the entire pipeline, operations teams don’t need to build or maintain a separate data lake. Orchestration and automation platforms can subscribe to the enriched event stream and launch remediation workflows (reroute around a flapping link, throttle a tenant, spin up extra cloud capacity) with confidence.
Bringing it all together with network intelligence
Network intelligence unifies every piece of telemetry—flows, routing updates, device metrics and synthetic tests—into a coherent story about how your network supports the business. It predicts outages before they hit, optimizes capacity, bolsters security and makes troubleshooting intuitive. Instead of frantically digging through data and constantly putting out fires, engineers gain superpowers: the ability to let machines handle repetitive analysis so they can focus on strategy and innovation. With costs optimized, performance assured and security enforced, your network becomes a smart, resilient foundation that propels the business forward.
How can Kentik bring the benefits of network intelligence to your organization?
Kentik offers a suite of advanced network intelligence solutions designed for today’s complex, multicloud network environments. The Kentik Network Intelligence Platform empowers network pros to monitor, run and troubleshoot all of their networks, from on-premises to the cloud.
Kentik’s network monitoring solution addresses all three pillars of modern network monitoring, delivering visibility into network flow, powerful synthetic testing capabilities, and Kentik NMS, the next-generation network monitoring system.
Start a free trial or request a demo to try it yourself.

